Why Pit Efficiency Matters More Than Ever in 2026
Casino operators across Macau and the broader APAC region face a familiar pressure: flat or declining table revenues colliding with rising labor and compliance costs. The margin between a profitable pit and a bleeding one often comes down to how efficiently each gaming table converts seat-time into revenue. Yet many properties still rely on manual fill counts, periodic chip audits, and dealer observation as their primary efficiency gauges — methods that leave significant money on the table.
Pit efficiency is not a single number. It is a composite of hands-per-hour velocity, chip settlement accuracy, seat occupancy rate, and operational downtime. When these four metrics move in the right direction simultaneously, gross gaming revenue (GGR) per table can increase 12–18 % without adding a single seat. This guide breaks down each metric, explains how to measure it accurately, and shows how modern technology — particularly RFID-enabled tables and real-time dashboards — can close the gap between current performance and theoretical optimum.
Core Pit Efficiency Metrics You Should Track
1. Hands-Per-Hour (HPH) Velocity
HPH measures how many game rounds a table completes in an hour. For baccarat, a well-run VIP table processes 55–70 hands; for mass-market tables, the range is 40–55. Anything below 40 signals a bottleneck — usually caused by manual chip counting, slow shuffling, or dealer hesitation on payout calculations.
Traditional measurement requires a floor supervisor with a clicker and a notepad, introducing sampling bias and lag. RFID-integrated tables solve this by automatically logging every hand start and end based on chip movement and card-dealing events, delivering HPH gains of 8–15 % within the first quarter as dealers no longer need to pause for manual chip verification.
2. Chip Settlement Accuracy
Every miscounted payout is a direct hit to revenue. Overpaying a player is an immediate loss; underpaying triggers disputes that consume dealer time and erode player trust. Manual settlements carry an error rate of 0.3–0.5 % by value — small in percentage terms, but on a table handling HKD 5 million daily, that is HKD 15,000–25,000 lost or disputed per day.
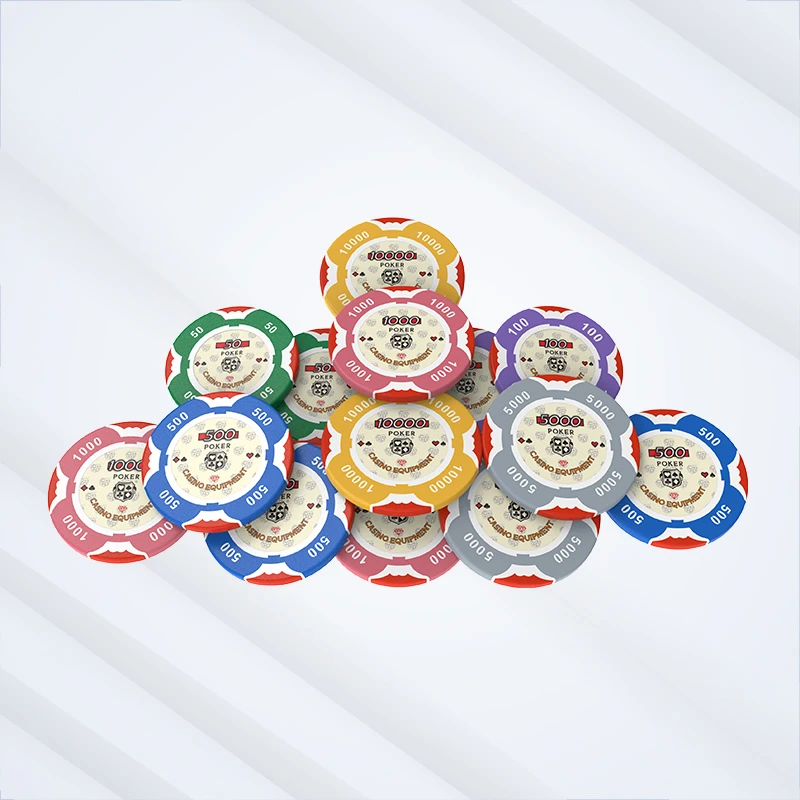
RFID chip tracking changes the equation. Each chip contains a passive tag that the table reader scans in real time. When a hand concludes, the system knows the exact wager amount and the correct payout, and it flags discrepancies before the next hand begins. Our article on the benefits of casino RFID chips for security and efficiency documents how chip-level tracking reduces settlement errors to under 0.02 % and eliminates the majority of payout disputes.
3. Seat Occupancy Rate
Occupancy rate — the percentage of available seats filled during operating hours — is a deceptively simple metric. The challenge is not measuring it once; it is measuring it continuously and correlating it with time-of-day, game type, and minimum-bet tier. A VIP baccarat table at 60 % occupancy with HKD 100,000 minimum bets generates far more revenue than a mass table at 100 % occupancy with HKD 300 minimums.
Real-time occupancy tracking enables dynamic decisions: adjusting minimum bets, reassigning dealers, or opening and closing tables to match demand curves. Integrated systems like the SIM Cage Management System feed cage-level chip flow data back to the pit, so managers can anticipate demand surges before they happen rather than reacting after players have waited too long.
4. Operational Downtime
Downtime includes chip fills, card changes, shift handovers, and equipment malfunctions. Each event pauses the table, and every minute of pause is revenue that never materializes. A single chip fill typically takes 3–5 minutes. On a busy Saturday night, a baccarat table might require 3–4 fills, costing 12–20 minutes of productive play.
Preventive strategies include predictive chip-level inventory alerts (triggering fills before the table runs low) and electronic card shoes that eliminate manual shuffling downtime. As covered in our article on the 2026 baccarat electronic shoe buying and usage guide, electronic shoes can shave 15–25 seconds off each hand cycle — compounding into an extra 8–12 hands per hour over a full shift.
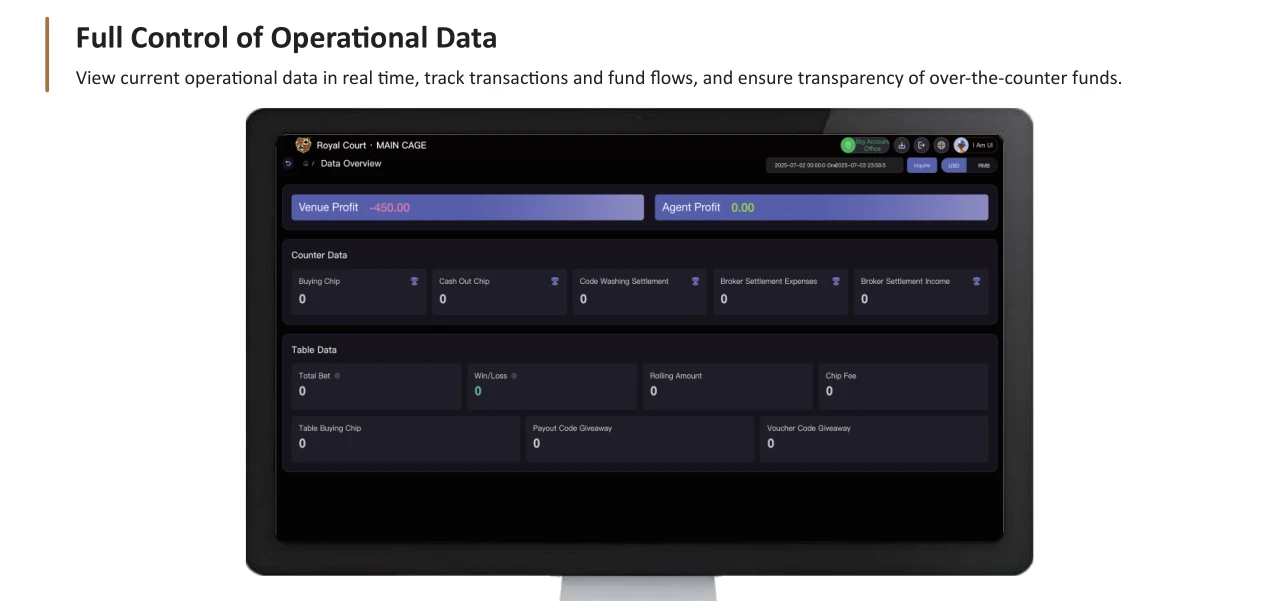
Building a Real-Time Pit Dashboard
Tracking these four metrics in isolation is better than not tracking them at all, but the real value emerges when they are unified on a single dashboard. A well-designed pit dashboard should display:
- Live HPH per table with color-coded thresholds (green ≥ 55, yellow 40–55, red < 40 for baccarat)
- Settlement variance — cumulative discrepancy between expected and actual chip values
- Occupancy heat maps — showing fill rates by time slot and game type
- Downtime event log — categorizing each pause and its duration
The dashboard pulls data from RFID table readers, the cage management system, and electronic shoe logs. Properties that implement this kind of integrated monitoring report 10–15 % improvement in GGR per table within six months, primarily from faster hands-per-hour and fewer unresolved settlement disputes.

Technology Investments That Directly Improve Pit Efficiency
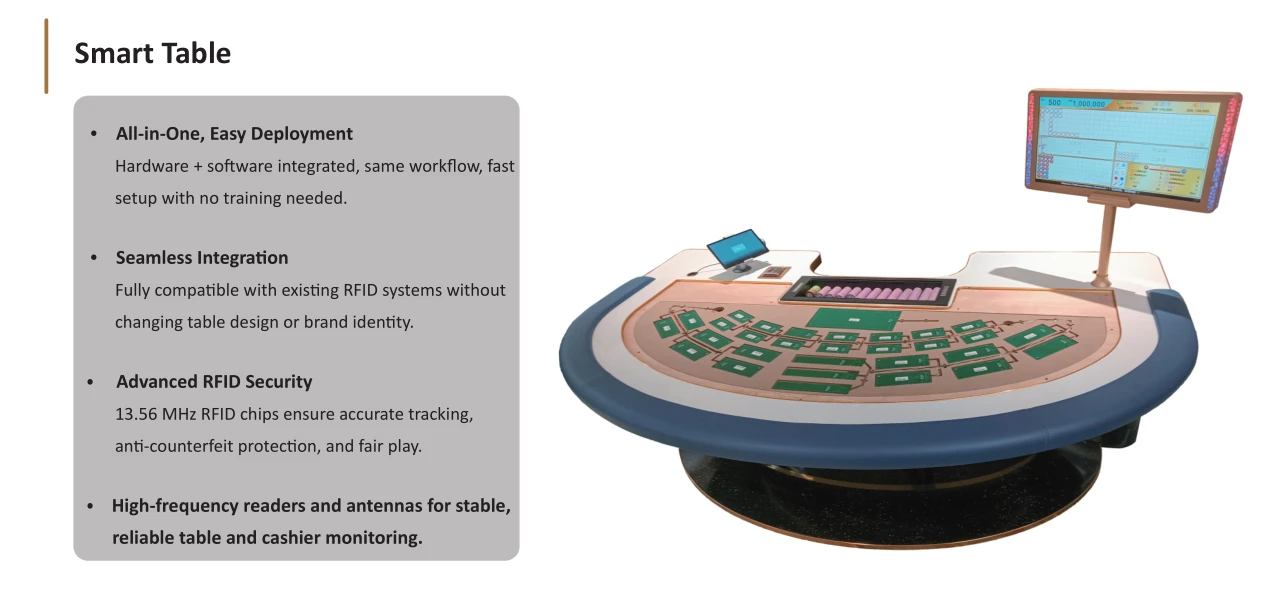
RFID-Ready Table Layouts
Not every property is ready to rip out existing tables and install fully integrated RFID units. A practical middle ground is RFID-ready table layouts — felt and substrate pre-wired with antenna arrays that can be activated when the property is ready to deploy readers. This approach preserves current table inventory while future-proofing the floor.
Electronic Card Shoes
Electronic shoes deliver two efficiency gains: faster deal cycles and built-in game-result verification. When paired with compatible electronic shoe units, operators can standardize equipment across the pit, reducing training time and maintenance overhead. The verification feature also protects against card manipulation, a compliance win that regulators in Macau and the Philippines increasingly expect.
Baccarat Roadmap Displays
Roadmap displays may seem like a player-facing amenity, but they contribute to pit efficiency in an indirect way: players who can see trend boards on baccarat roadmap display systems place bets faster and with less dealer assistance, which increases HPH. Dual-sided displays — visible to both players and standing spectators — further reduce the time dealers spend answering “what was the last result?” questions.
Handheld RFID Terminals
For pits that are not yet fully RFID-table equipped, portable RFID handheld terminals allow supervisors to scan chip stacks during fills and audits, cutting verification time from 3 minutes to under 30 seconds. This alone can reclaim 8–10 minutes per shift per table in reduced fill downtime.
Calculating the ROI of Pit Efficiency Improvements
The business case for technology-driven efficiency gains rests on a straightforward formula:
Additional GGR = (Δ HPH) × (Average Wager per Hand) × (House Edge) × (Operating Hours)
Consider a property with 50 baccarat tables operating 20 hours daily:
- Baseline HPH: 48
- Post-RFID HPH: 55 (a realistic 14.6 % gain)
- Average wager per hand: HKD 8,000
- House edge: 1.24 % (banker bet)
Additional daily GPR per table = 7 × 8,000 × 0.0124 = HKD 694
Additional daily GGR (50 tables) = HKD 34,736
Additional monthly GGR ≈ HKD 1.04 million
Against a typical RFID table deployment cost of HKD 80,000–150,000 per unit (including reader, software license, and installation), the payback period is 4–7 months depending on table count and average wager size. This does not even account for the secondary savings from reduced chip losses, fewer disputes, and lower supervisor headcount requirements.
Implementation Roadmap: From Measurement to Action
Deploying pit efficiency improvements is not an all-or-nothing decision. A phased approach reduces capital risk and allows the property to validate ROI at each stage:
Phase 1 — Measure (Month 1–2)
Install RFID readers on 5–10 pilot tables. Collect baseline data on HPH, settlement accuracy, occupancy, and downtime without making any operational changes. This data becomes the benchmark for all future comparisons.
Phase 2 — Optimize Manual Processes (Month 3–4)
Use dashboard insights to adjust dealer rotation schedules, fill timing, and minimum-bet tiers. These changes cost nothing but typically yield 3–5 % HPH improvement by eliminating obvious bottlenecks identified in Phase 1 data.
Phase 3 — Deploy Technology Enhancements (Month 5–8)
Roll out electronic shoes, baccarat table upgrades, and handheld terminals across the pilot zone. Track incremental HPH and settlement improvements. Expect a cumulative 10–15 % efficiency gain over baseline.
Phase 4 — Full-Floor Expansion (Month 9–12)
With validated ROI in hand, extend RFID and efficiency technology to the full gaming floor. Integrate cage management and surveillance systems for end-to-end visibility. Cage-pit integration alone can reduce chip reconciliation time by 60 % and virtually eliminate end-of-shift balancing errors.
Frequently Asked Questions
What is a good hands-per-hour rate for a baccarat table?
A well-operated VIP baccarat table should consistently achieve 55–70 hands per hour. Mass-market tables typically run 40–55 HPH. Rates below 40 indicate operational bottlenecks that technology or process improvements can address.
How does RFID improve pit efficiency?
RFID improves pit efficiency by automating chip counting (reducing fill time), enabling real-time settlement verification (eliminating payout disputes), and providing continuous occupancy data (allowing dynamic table management). Combined, these capabilities increase hands-per-hour by 8–15 % and reduce settlement errors by over 90 %.
What is the payback period for RFID table technology?
Based on typical Macau table economics, RFID table deployments pay back in 4–7 months. The exact period depends on average wager size, current HPH baseline, and the number of tables deployed. Properties with higher wager tables see faster returns.
Do I need to replace all tables to get efficiency gains?
No. A phased approach starting with 5–10 pilot tables delivers measurable ROI without a full capital commitment. RFID-ready table layouts allow existing tables to be upgraded incrementally, and handheld terminals can supplement non-RFID tables during the transition period.
How do electronic shoes contribute to pit efficiency?
Electronic shoes reduce per-hand cycle time by 15–25 seconds by eliminating manual shuffling, and they provide built-in game-result verification that prevents disputes. Over a 20-hour operating day, these time savings compound into 8–12 additional hands per hour per table.